Revenue & Expenditure Summary
Revenue
- Total statewide court revenue increased 4.4% from $410.3 million in FY 2009 to $428.3 million in FY 2010, reflecting the continuing efforts of the courts statewide to collect court-ordered fines, fees, and surcharges. See Chart A.
- Statewide revenue increased by 0.6% in FY2010 compared with FY2009 and 4.4% with State Photo Enforcement included.
- This graph represents the trend in increased court revenue above the $70 million benchmark established in FY 1988. Since that time, courts have collected approximately $3.148 billion in additional revenue. See Chart B.
- Of the total court system revenue, the state received 45.5%, counties received 30.5% and cities and towns 24.0%. See Chart C.
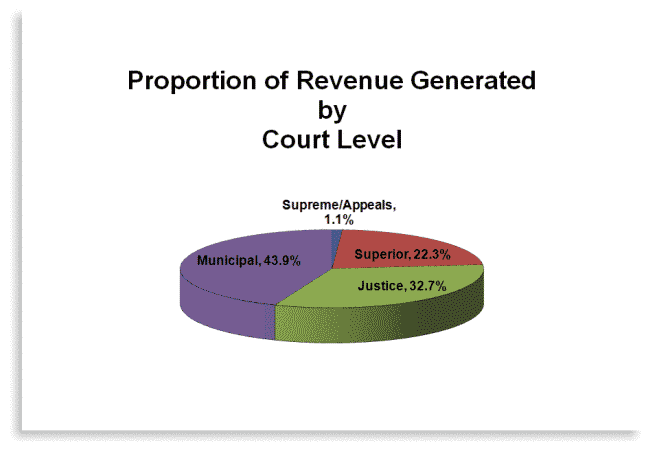
- 43.9% of total court revenue was generated by municipal courts, 32.7% by justice courts, 22.3% by Superior Court and 1.1% by appellate courts. See Chart D.
- Total restitution payments for victims collected by Courts decreased 7.6% from $18.5 million in FY 2009 to $17.1 million in FY 2010.
Graph A
Graph B
Graph C
Graph D
Expenditures
- Total statewide court expenditures decreased 5.2% from $740.7 million in FY 2009 to $701.9 million in FY 2010. See Graph A.
- 61.9 % of the total funds spent by the court system were from the counties, 22.0% from the state, 14.7% from cities and towns, and 1.4% from federal and private sources. See Graph B.
- 67.3% of total court expenditures were in Superior Court (including probation), 14.7% in municipal courts, 11.0% at the appellate level (including statewide administration) and 7.0% in the justice courts See Graph C.
Graph A
Graph B
Graph C